Montréal Commercial Real Estate market: Insights from the Big Four (2025)
In today’s commercial real estate (CRE) landscape, information is power. Data has become an asset class of its own—one that defines how quickly organizations can react, reposition, and outperform.
The industry’s leading firms—JLL, CBRE, Colliers, and Cushman & Wakefield—aren’t just market players; they are market-makers. Their advantage lies not only in the scale of their transactions but in the depth and precision of their market intelligence.
Their research teams continuously track capital flows, occupancy levels, and development pipelines across global and local markets. For investors, developers, and corporate real estate leaders, this data represents more than just insight—it’s a strategic advantage that helps them anticipate cycles, mitigate risk, and capture opportunity ahead of the curve.
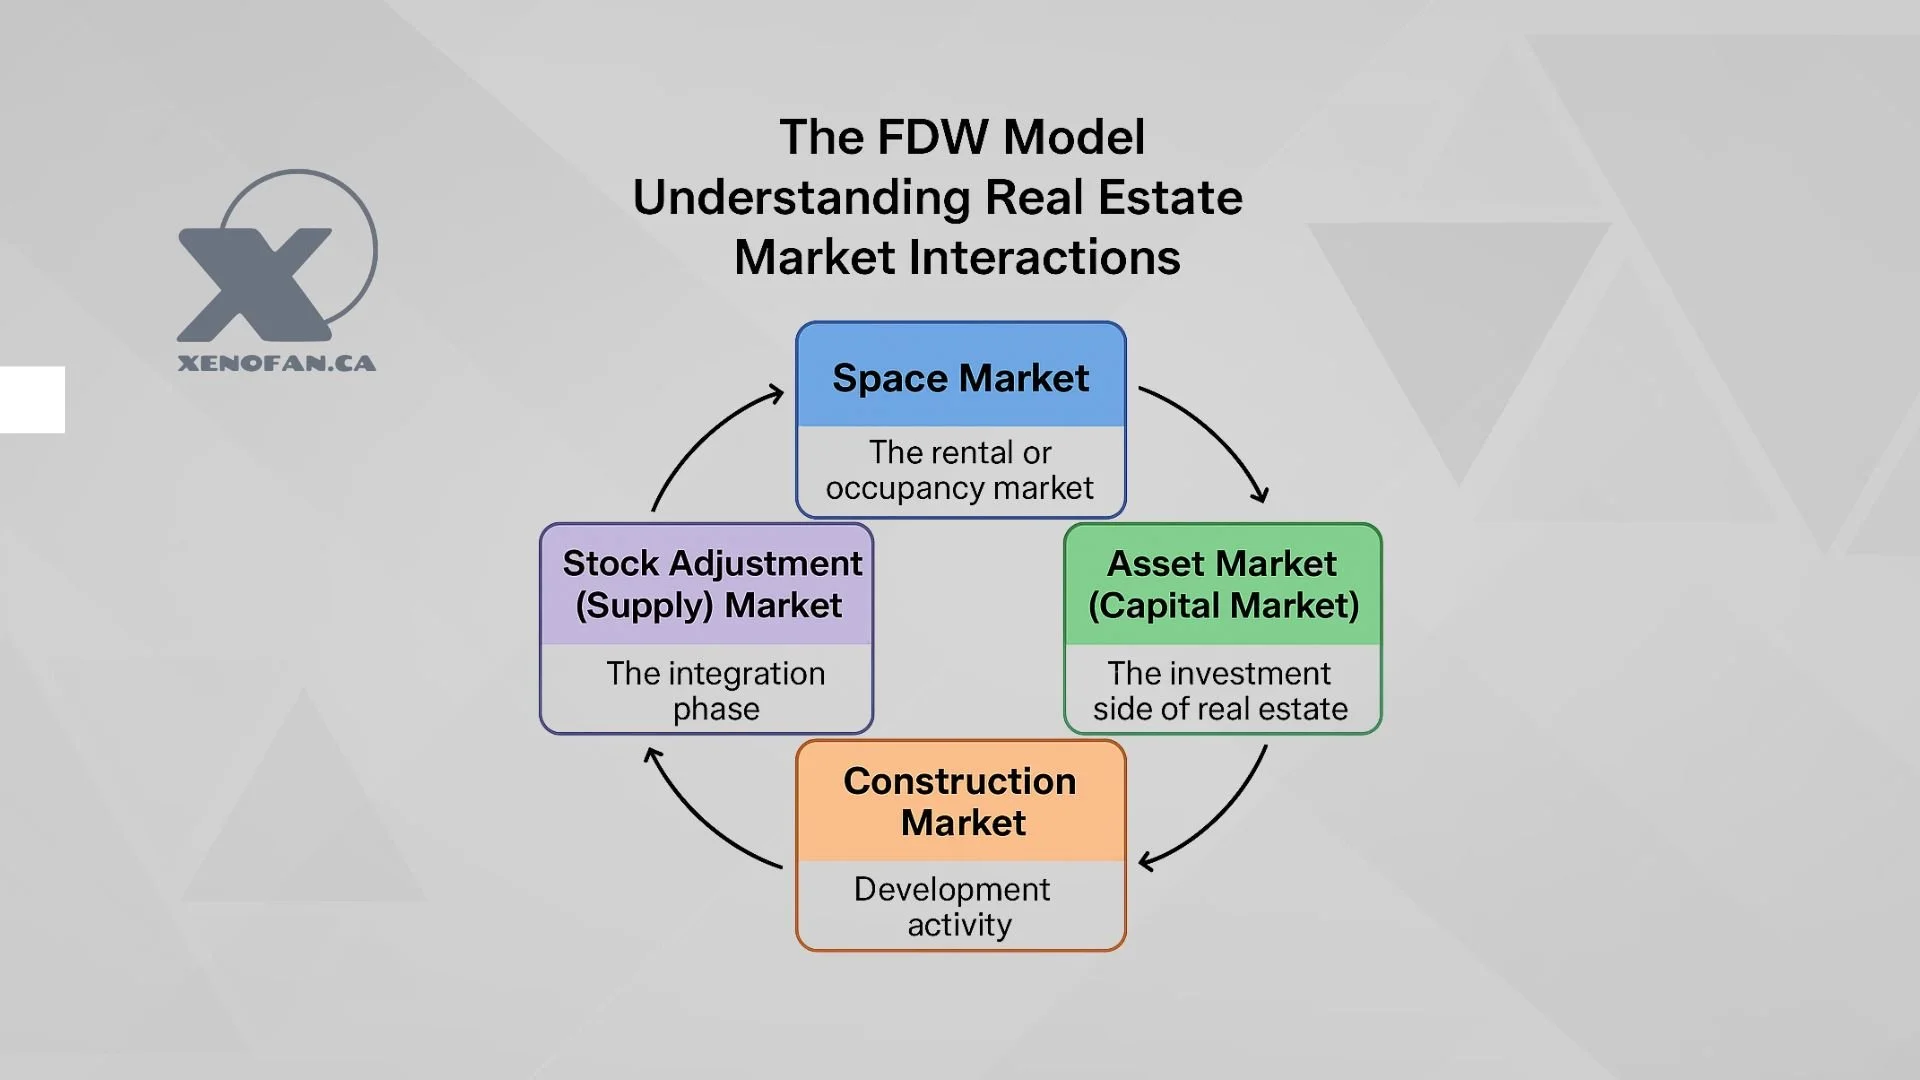
The four interconnected real estate markets (FDW framework)
The Fischer–DiPasquale–Wheaton (FDW) model remains one of the most insightful frameworks for understanding how real estate markets move and interact. It divides the system into four interconnected markets, each influencing the next in a continuous feedback loop.
1. The space market — The market for Use
This is where tenants meet landlords. Lease rates and occupancy levels are determined by the balance between available inventory and economic demand. When business activity, employment, or GDP rise, demand for space increases, pushing rents upward—until new supply enters the market and restores balance.
2. The asset market — The market for investment
Here, investors price properties based on expected income and target returns. The simple relationship is: Property Value = Net Operating Income ÷ Capitalization Rate.
Changes in rents or interest rates ripple directly through this market, shaping valuations and influencing investment volumes.
3. The construction market — The market for development
When property prices exceed replacement costs, developers act. They bring new projects into the pipeline, turning investment signals into physical supply. This new construction eventually alters availability and rent trajectories.
4. The stock market — The market for existing supply
As new buildings are completed, they add to total inventory—offset by aging stock and obsolescence. Over time, this process determines the long-term equilibrium between supply and demand.
Together, these four markets create the foundation for real estate cycles—periods of growth, stabilization, and correction driven by the interplay between rent, price, and construction activity.
Montréal market snapshot — Q2 2025
Asset market overview
Montréal’s investment market remains fundamentally stable, with capitalization rates reflecting both investor caution and a sustained premium for quality.
Downtown offices trade between 6.5 % and 7.5 %, while suburban offices range from 7.5 % to 9.5 %, reflecting locational risk differentials.
Industrial assets remain highly sought-after, with cap rates between 5.75 % and 6.75 %, driven by strong tenant demand and constrained supply.
Retail investment remains selective, with prime locations yielding between 6 % and 7.5 %.
The multifamily sector continues to command investor attention, with cap rates in the 4.25 % to 5.25 % range—an indicator of strong demand and limited product.
Hospitality assets are still in recovery mode, with downtown hotels showing cap rates between 6.5 % and 7.5 %, and suburban hotels between 8.5 % and 9.5 %.
Space market overview
The office market continues to recalibrate around new workplace realities.
Average gross rents stand near $43 per square foot downtown and $32 per square foot across the broader metro area.
Vacancy rates remain elevated at 19 % across approximately 107 million square feet of office space.
Roughly 100,000 square feet of new inventory were delivered this quarter, with another 250,000 square feet under construction.
The industrial sector remains Montréal’s standout performer.
Average net rents are close to $15 per square foot, supported by logistics and manufacturing demand.
Vacancy is a low 6 % across about 370 million square feet of inventory.
Around 500,000 square feet of new space were completed this quarter, and 1.7 million square feet remain under construction—clear evidence of ongoing momentum.
Key takeaways for decision-makers
Montréal’s CRE market is transitioning from volatility to strategic normalization. The next cycle will reward investors and managers who:
Leverage data-driven intelligence to anticipate demand shifts;
Prioritize adaptable assets that can serve multiple uses over time;
Balance return expectations with operational and financing realities; and
Position portfolios around resilient asset classes—industrial and multifamily remain top contenders.
In an environment where information defines performance, clarity is capital. Montréal’s fundamentals remain sound, but strategic agility will determine who captures the next wave of opportunity.
Deliver your next project with confidence
At Xenofan, we help investors and real estate leaders turn market insight into action.
At Xenofan, we help commercial clients in the Greater Montréal area plan, manage, and deliver projects that perform—on every level. Whether you’re renovating, expanding, or reconfiguring your workspace, we bring a client-focused approach built on three principles:
Plan better — by aligning every decision with your business goals and budget.
Communicate clearly and transparently — ensuring you’re informed and in control at every stage.
Deliver exceptional results — with precision, professionalism, and accountability.
Partner with a team that sees your project through your eyes. Start your next commercial renovation with Xenofan today, where planning meets performance.
Other interesting articles:
How to Maintain the Value of Commercial Real Estate Properties
Pôles d’aménagement TOD pour la Rive-Nord : Terrebonne, Blainville, Mirabel et Mascouche