
Understanding Market Indicators in Commercial Real Estate
Commercial real estate market reports can feel overwhelming, packed with tables of numbers like inventory, net absorption, vacancy rate, and asking rent. Despite their complexity, these metrics provide a clear picture of how the market is performing, whether space is in demand, how much is available, and what tenants are paying.
Here’s a simple guide, made simple, to understanding market indicators in Commercial Real Estate (CRE). It is organized into four key groups.
The unit of area used is the square foot (s.f.) and sometime written p.s.f. to mean per square foot.
1. Property classification
The first step in analyzing a market is understanding the type and quality of buildings:
Class of buildings
Buildings are grouped based on age, quality, and location:
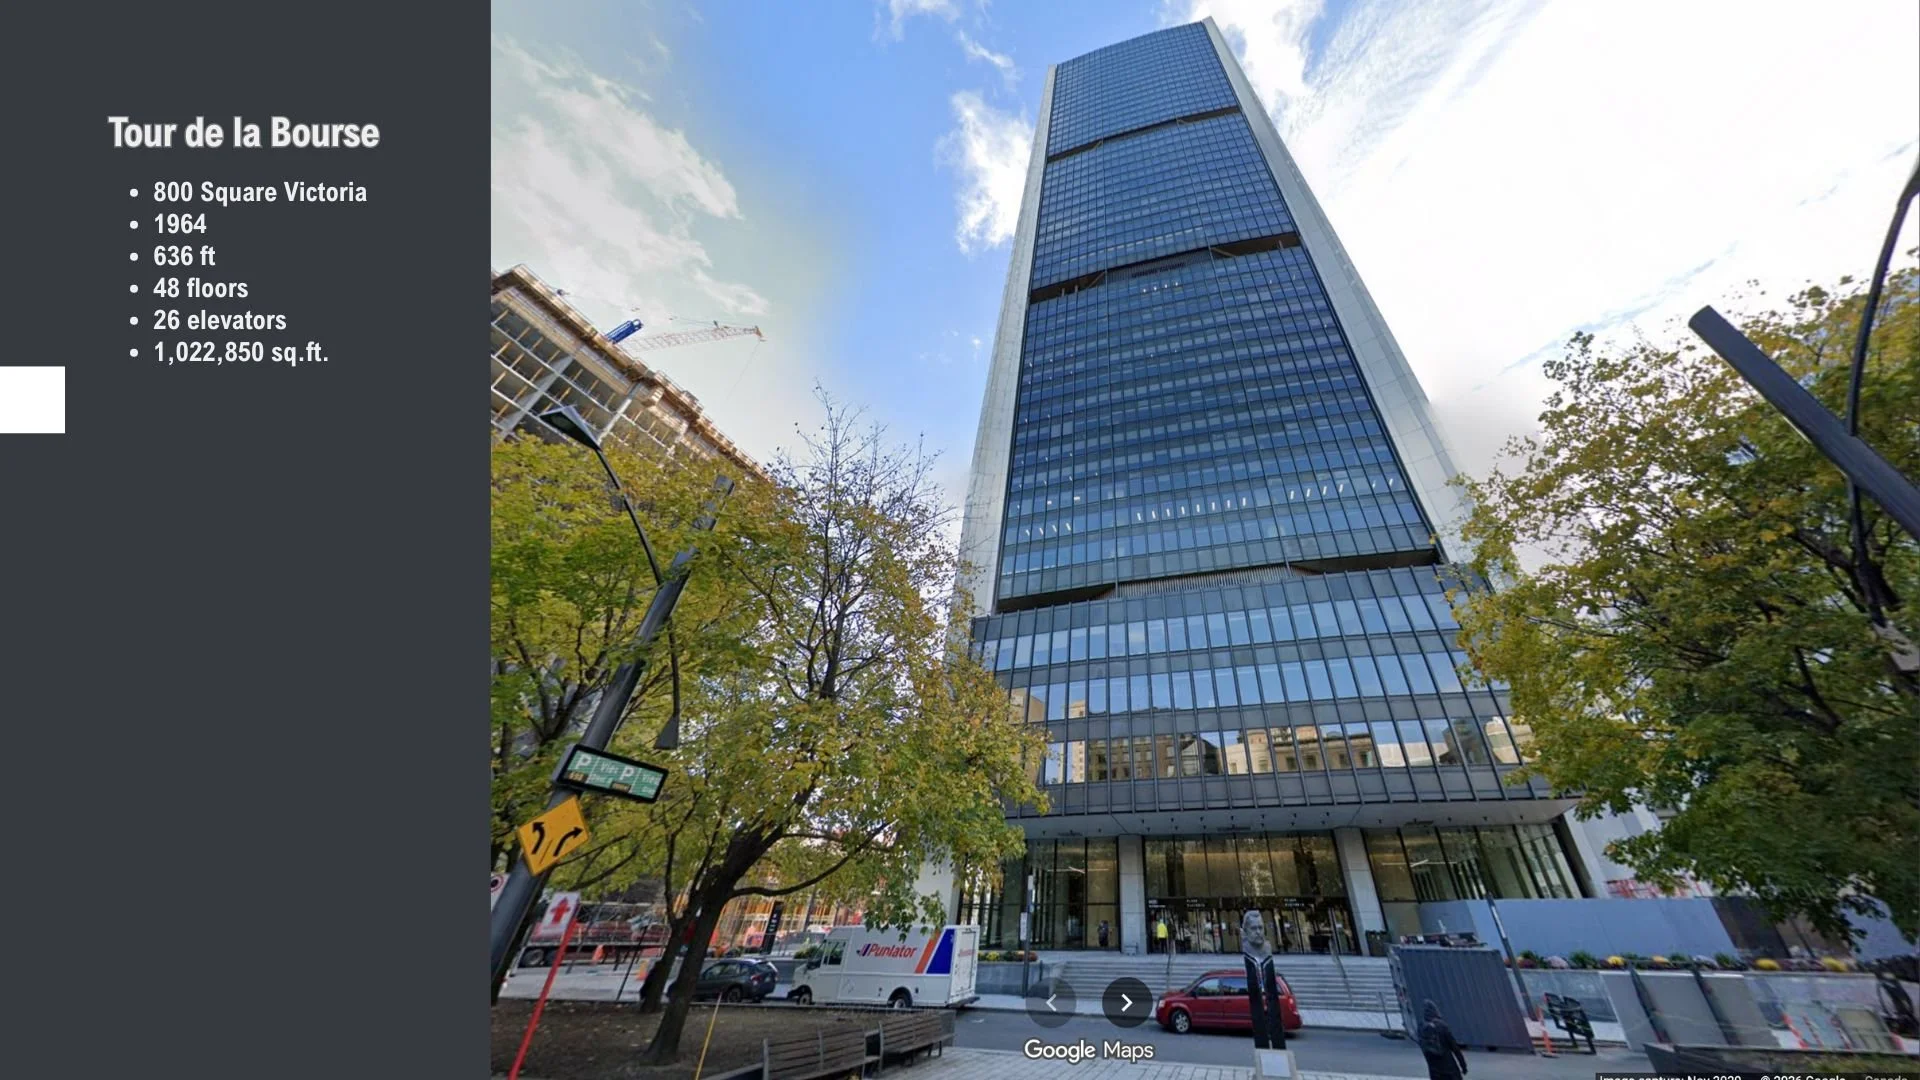
Class AAA / Trophy: Ultra-premium buildings in the best locations with exceptional design, state-of-the-art systems, and top-tier amenities. Often referred to as “trophy properties”, these attract the highest rents and are highly sought after by premium tenants.
Class A: High-end, modern buildings in prime locations with premium finishes and amenities.
Class B: Well-maintained, slightly older buildings in secondary locations, offering solid value.
Class C: Functional but lower-grade buildings, typically older and less updated.
These classifications help compare rental rates, demand, and investment performance across different property types.
Total inventory (s.f.)
Inventory represents the total commercial space in the market, measured in square feet. Think of it as the size of the “real estate pool” — all offices, warehouses, or retail spaces being tracked.
2. Market supply
These metrics show how much space is on the market, either currently vacant or expected to become available:
Direct available space (s.f.): Space available directly from landlords for lease.
Sublease available space / Sublease vacancy (s.f.): Space being offered by existing tenants, often due to downsizing or workplace changes such as remote work. Sublease vacancy is a key indicator of tenant turnover and potential market softness.
Total available space (s.f.): The sum of direct and sublease space.
Vacancy Rates
Direct Vacancy (%) – Percent of empty space available from landlords.
Sublease Vacancy (%) – Percent of space available specifically for sublease.
Total Vacancy (%) – Percent including both direct and sublease space.
Forward looking
Availability rate (%): The percentage of total inventory that is either vacant or soon to be available.
New supply (s.f.): The amount of space newly completed and delivered to the market.
Under construction (s.f.): Space currently being built, providing insight into future market supply.
3. Occupancy
These numbers reveal how much space is being leased and how demand is trending:
Net absorption (s.f.): The change in occupied space over a given period. Space leased minus space vacated. Positive absorption indicates strong demand; negative absorption suggests weakening demand.
Quarterly net absorption: Change during the most recent quarter.
Year-to-date (YTD) net absorption: Cumulative change since the start of the year.
YTD net absorption (% of stock): How much of total inventory this change represents.
4. Rental costs
These metrics help tenants and investors understand pricing and true occupancy costs:
Direct asking net rent ($ p.s.f.): The base rent per square foot, excluding additional operating costs.
Additional rent ($ p.s.f.): Operating costs or CAM charges (Common Area Maintenance), covering maintenance, taxes, cleaning, and insurance.
Direct asking gross rent ($ p.s.f.): The total rent including both net rent and additional rent.
Example, Montreal
In Montréal, during Q2 2025, according to JLL, one of the big four, the total commercial inventory is approximately 107 million s.f., with a negative YTD net absorption of 642,000 s.f. and a total vacancy rate of 19.2%. The average asking net rent is $20.38, with additional rent around $17.53, resulting in an average gross rent of $39 p.s.f. Rents vary by building class, reaching up to $43 for Class A properties and $64 p.s.f. for Class AAA buildings.
Summary
By understanding these four key groups — Property classification, Market supply, Occupancy, and Rental costs — you can read any commercial real estate report with confidence. Each metric tells a piece of the story, and together they provide a complete picture of market health, tenant demand, and pricing trends.